
About VCSEL and III-V Oxide Layer Characterisation
At the end of every ALOXTEC oxidation cycle, before the wafer leaves the chamber, the in-situ vision system executes a complete characterisation sweep of the oxide layer across the full wafer surface. This sweep generates five simultaneous measurement outputs, each capturing a distinct dimension of process and device quality. Together, they provide a complete, quantitative picture of what happened during the oxidation run: not a summary indicator, but a spatially resolved, die-level dataset that spans process quality, device performance prediction and upstream EPI quality assessment.
This page is not about the instrument that generates these measurements. The hardware architecture of ALOXTEC’s in-situ vision system, its components and their individual metrological capabilities, is described on the Real-Time In-Situ Monitoring System page. This page addresses a different question: given the five measurement outputs in front of you, what does each one tell you about your process, and what do you do with that information?
The answer to that question operates on two levels: process control, where measurements drive immediate corrective actions on the current or next run, and process diagnosis, where measurement patterns reveal the root cause of non-conformance and direct corrective action to the right process step, which may be upstream of the oxidation furnace.
In a conventional wet oxidation process without in-situ characterisation, process quality assessment requires a dedicated post-process metrology step on a separate tool. This step adds cycle time, handling risk and equipment cost to every run. More importantly, it defers the availability of process quality data by the duration of the metrology step and the queue time preceding it.
In practice, this deferral means that a uniformity deviation detected on wafer N is not available as corrective feedback until after wafer N+1, N+2, or more have already been processed under the same out-of-control conditions. The number of affected wafers depends on the queue time to metrology and the production cadence of the tool. In high-volume production, even a modest deferral of a few hours can result in an entire lot being exposed to an undetected process excursion before corrective action is possible.
In-situ characterisation at process endpoint eliminates this deferral entirely. Process quality data is available before the wafer is unloaded. A uniformity deviation detected on the current wafer is available as corrective feedback before the next wafer enters the furnace. The feedback loop from measurement to corrective action is compressed from hours to minutes.
This compression of the feedback loop is not a convenience improvement. It is a structural change in the yield architecture of the oxidation step. The ability to detect and correct process excursions at the single-wafer level, rather than at the lot level, reduces the exposure of production material to out-of-control process conditions by an order of magnitude. For Tier 1 VCSEL manufacturers running continuous production campaigns, this capability is a primary driver of the total cost of ownership advantage delivered by the ALOXTEC equipment portfolio.
The five outputs of the ALOXTEC characterisation system address five distinct questions that a process engineer needs to answer at the end of every oxidation run. The table below maps each output to the process question it answers, the corrective action it drives when out of specification, and the applications for which it is most critical.
| Measurement output | What it reveals about the process | Corrective action if out of specification | Application criticality |
|---|---|---|---|
| Oxidation depth map | Lateral extent of AlOx conversion at every measured mesa across the wafer. Reveals how far the oxidation front has advanced from each mesa edge, and whether this advance is uniform across the wafer surface. | Centre-to-edge or azimuthal depth gradients indicate temperature or water vapour non-uniformity within the chamber. Corrective action targets the T/H/P parameter responsible for the observed gradient pattern. UniformPerf© addresses systematic spatial gradients at their physical source. | First quantitative indicator of EPI compositional uniformity. Dies with anomalous oxidation depth at equivalent process conditions reveal local Al content deviations in the epitaxial layer, independent of furnace non-uniformity. |
| Aperture size map | Oxide aperture diameter at every measured die across the wafer. The direct translation of oxidation depth into the geometric parameter that determines threshold current, slope efficiency and emission wavelength of each individual device. | Mean aperture outside target: adjust Stop-on-Aperture target for subsequent runs. Aperture spread exceeding specification: investigate T/H/P gradients and EPI uniformity. Systematic wafer-level gradient: engage UniformPerf©. | The primary yield control parameter. Every die on the wafer map is assigned a measured aperture diameter that directly predicts its electrical and optical specification compliance. The aperture map is the wafer-level yield predictor. |
| Circularity index | Quantitative roundness of the oxide aperture at each mesa, expressed as the ratio of the minimum to maximum aperture diameter measured across all angular orientations. A perfectly circular aperture has a circularity index of 1.0. | Systematic low circularity across the wafer indicates asymmetric T/H/P conditions within the chamber, producing directionally biased oxidation. Mesa-specific low circularity may indicate local etch non-uniformity in upstream steps. | Critical for single-mode VCSEL beam quality and far-field pattern symmetry. In LiDAR VCSEL arrays, aperture circularity determines beam divergence symmetry and pointing accuracy. In fibre-coupled devices, elliptical apertures reduce coupling efficiency. |
| Mesa size map | Full geometric characterisation of each mesa structure: etch dimensions, shape and positional accuracy across the wafer. Measured at run start and available as a reference dataset throughout the process cycle. | Mesa size variations outside specification are not attributable to the oxidation step: they reveal lithography or etch process variations from upstream steps. Enables cross-step root cause analysis. | Transforms the ALOXTEC system into a cross-process diagnostic technology. Only in-situ measurement in oxidation that directly characterises upstream process quality. |
| Emitting wavelength map | Spatial distribution of VCSEL emission wavelength across the wafer, measured in real time during oxidation via the monochromator channel. Depends on cavity optical path length and oxidation state. | Wavelength gradient correlated with oxidation depth: process-induced → adjust T/H/P + UniformPerf©. Not correlated: EPI-induced → feedback to supplier. | Critical for WDM datacom applications (channel alignment) and LiDAR systems (ranging accuracy and interference immunity). |
The five outputs are generated simultaneously, on the same wafer, in the same measurement sweep. This simultaneity is not a convenience feature: it is a diagnostic enabler. Because all five measurements share the same spatial reference frame and the same moment in process time, correlations and anti-correlations between them carry direct diagnostic information about the origin of any observed non-conformance.
An aperture gradient that correlates spatially with an oxidation depth gradient points to a furnace process origin: non-uniform T/H/P conditions within the chamber. The same aperture gradient that does not correlate with an oxidation depth gradient points to an EPI origin: compositional or structural variation in the epitaxial layer that produces different aperture sizes at the same oxidation depth. Without simultaneous measurement of both outputs, this distinction is not accessible from the characterisation data alone.

The five-output characterisation dataset enables a class of process diagnosis that extends beyond the oxidation step itself. Because the mesa size map characterises the upstream etch geometry, and because the oxidation depth and aperture maps characterise the oxidation step, the correlation between these datasets allows process engineers to distinguish between deviations that originate within the oxidation furnace and deviations that originate in upstream lithography and etch steps. The ALOXTEC characterisation system is the only in-situ measurement tool in the VCSEL fabrication flow that provides this cross-step diagnostic capability.
The table below maps the primary observation patterns in the five-output dataset to their process root causes and the scope of corrective action they require.

| Observation pattern | Process root cause | Corrective action scope |
|---|---|---|
| Oxidation depth gradient with radial symmetry (centre-to-edge) | Radial temperature gradient within the furnace chamber. The wafer centre is at a different temperature than the edge, producing a systematic oxidation rate difference that follows the thermal profile. | Furnace process: T/H/P parameter adjustment or UniformPerf© thermal gradient compensation. Not attributable to EPI or upstream lithography. |
| Oxidation depth gradient with azimuthal asymmetry (one-sided) | Asymmetric water vapour distribution within the chamber, or a localised temperature asymmetry. The oxidation front advances faster on one side of the wafer than the other. | Furnace process: water vapour delivery optimisation or chamber flow field adjustment. UniformPerf© flow field homogenisation addresses this class of non-uniformity. |
| Aperture non-uniformity not correlated with oxidation depth gradient | EPI Al content non-uniformity. Different regions of the wafer contain AlGaAs with slightly different Al mole fraction, producing different oxidation rates at identical T/H/P conditions and identical oxidation times. | Epitaxial growth: actionable feedback to the EPI supplier on the spatial pattern of Al content non-uniformity across the wafer. Not addressable within the oxidation process step. |
| Isolated mesa anomalies (single or small cluster of outlier dies) | Local defects in the epitaxial layer (particles, growth defects) or localised lithography and etch variations affecting specific mesa structures. | Cross-step investigation: correlate with upstream inspection data. The mesa size map provides the etch geometry reference that enables systematic correlation between oxidation anomalies and upstream process deviations. |
| Wavelength gradient correlated with aperture gradient | Process-induced: the oxidation step is producing a spatial variation in both aperture size and effective refractive index, consistent with a T/H/P non-uniformity origin. | Furnace process: same corrective actions as for aperture non-uniformity. The wavelength gradient is a corroborating indicator, not an independent source of non-uniformity in this case. |
| Wavelength gradient not correlated with aperture gradient | EPI-induced: spatial variations in cavity optical path length that are independent of oxidation depth, reflecting non-uniformity in the epitaxial layer thicknesses or compositions. | Epitaxial growth: wavelength gradient is a direct, quantitative indicator of EPI thickness or composition non-uniformity. Actionable feedback to the EPI supplier, independent of the oxidation process. |
A particularly significant application of the cross-step diagnostic capability is the use of the oxidation characterisation dataset as an EPI quality screening tool. Because the oxidation rate is a strong function of the local Al content of the epitaxial layer, spatial variations in oxidation depth at constant T/H/P conditions are a direct, quantitative indicator of Al content non-uniformity in the EPI wafer. This makes the oxidation depth map a high-sensitivity, wafer-level compositional uniformity map, generated automatically on every production run, without any additional measurement step or equipment.
For process engineers managing EPI supplier qualification and incoming material quality, the longitudinal dataset of oxidation depth maps across multiple wafers and lots provides a continuous, quantitative record of EPI uniformity performance that is far more sensitive than conventional post-epitaxy characterisation methods such as photoluminescence mapping or X-ray diffraction.
Pre-sales open
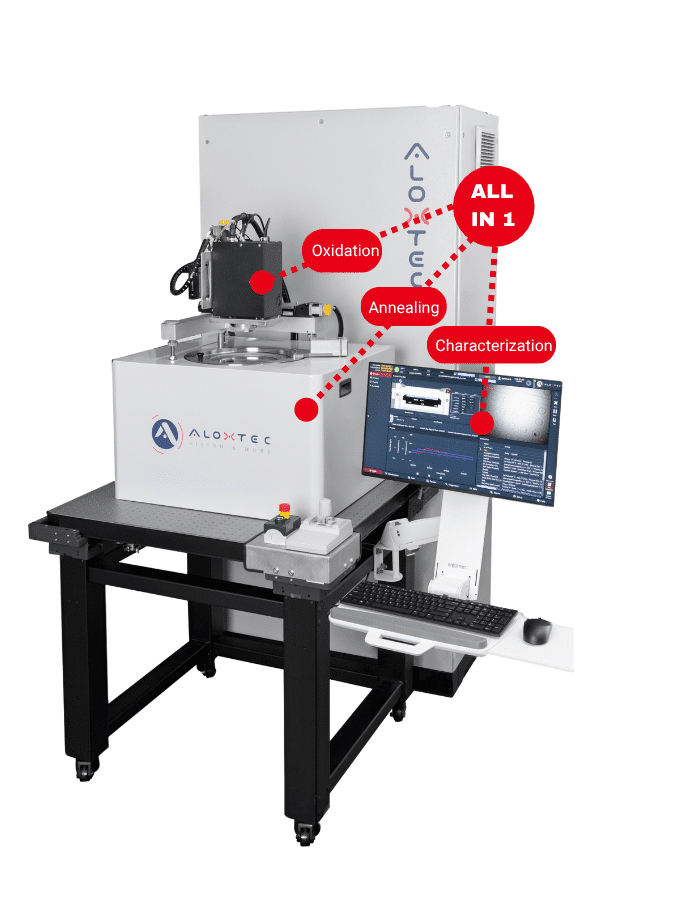
The CHAROX 1.0 characterisation station is built on a vibration-isolated optical table, providing the mechanical stability required for ultra-precise aperture measurement outside the furnace environment. It accepts wafers from any oxidation system, including non-ALOXTEC furnaces, making it possible to introduce ALOXTEC-grade characterisation capability into an existing process flow without replacing the oxidation tool.
For production environments where characterisation throughput must be decoupled from oxidation throughput, the CHAROX 1.0 can be configured with optional automation for continuous, unattended operation. This enables dedicated QC workflows where a subset of production wafers is characterised to a higher spatial density or with additional measurement parameters, while the oxidation furnace continues to run at full throughput.
The measurement outputs of the CHAROX 1.0 are identical in format and content to those generated by the in-furnace ALOXTEC characterisation system. Process recipes, measurement grids and acceptance criteria defined on the in-furnace system transfer directly to the CHAROX 1.0 without modification, ensuring consistency across characterisation modes.


The structured, quantitative nature of the five-output dataset makes it directly compatible with statistical process control (SPC) frameworks at the production level. Key metrics extracted from the characterisation data, including mean aperture diameter, aperture min-max spread, run-to-run sigma, mean circularity index and wafer-level wavelength range, can be trended over time to detect systematic process drift before it produces out-of-specification wafers.
The availability of this dataset in real time through the SECS/GEM interface, as described on the Real-Time In-Situ Monitoring System page, means that SPC charts can be updated at the completion of each run and alarm thresholds can trigger automatic lot hold or process review workflows in the fab MES. This closes the loop between in-situ characterisation and production automation at the system level.
The die-level aperture size map generated at the end of each run is structurally equivalent to a wafer-level yield prediction map. Each die on the map carries a measured aperture diameter that can be compared directly against the specification window for threshold current, wavelength and modulation performance. Dies that fall within the specification window are predicted to pass electrical test. Dies that fall outside it are predicted to fail.
The correlation between the in-situ aperture map prediction and the final electrical test yield can be tracked over time, building a quantitative model of the aperture-to-yield transfer function for each device type and each EPI generation. This model progressively reduces the uncertainty in yield prediction from oxidation data and enables more accurate lot disposition decisions based on in-situ characterisation results alone, before electrical test.
Oxide layer characterisation is not only a measurement step, but a decision framework for process engineers. By combining multiple spatially resolved datasets acquired simultaneously at process endpoint, it becomes possible to understand not only what happened during oxidation, but why it happened and where corrective action must be applied. The following questions address how characterisation data is used for process control, yield optimisation and root cause analysis.
 Save as PDF